The state of taxation: How taxes differ by state
- Mark Mooring

- Jan 10, 2024
- 1 min read
Updated: Jun 20, 2024
When you think about the impact that taxes have on household finances most people think about federal income tax. But state and local taxes can have a big impact too. If you’re interested to know more about exactly how much impact where you live (or are thinking about moving) has on your disposable income, I’ve collected some informative maps for you.
The maps are generated by the Tax Foundation, and they can help you better understand the tax ramifications of where you live or may want to retire. When you’re looking at the maps that follow, consider your specific situation. Will you have taxable income in retirement, such as a pension or traditional IRA/401(k)? Will you spend most of your retirement funds shopping or traveling? Will you own a home or live in a van down by the river? Since every state must raise revenue somehow, you may find a place where you’re less impacted by those efforts than you would be in a different state.
It’s worth mentioning that these maps are a bit oversimplified. They are a tool to give you a general comparison. A place to start your own research. To view the map for each section, click on the arrow to expand.
Income taxes: Of course, this one must be first. It’s the first item that comes to mind when we think about state taxes. If you’re generating income via wages, pensions, or rental homes, pay close attention to this first map.

Sales Tax: The above map, beautiful though it is, only tells part of the story. While income taxes hurt every April, the next map highlights the pain you feel every on every purchase: state and local sales tax.

Property Tax: Generally, states that are more friendly on income or sales tax make it up with property tax. Unless you plan to retire in a tent hiding from the revenue man deep in a national forest, property taxes will hit you whether you rent or buy your home.

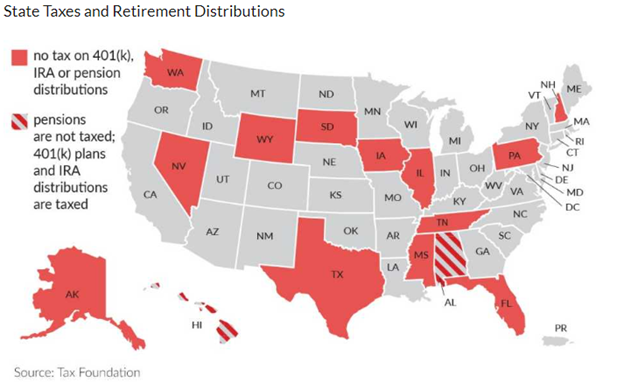
Retirement Income Tax: If your retirement will be funded entirely with 401(k), IRA, or pension distributions, this map is for you! Some states have elected to protect retiree assets and entitlements from income tax. These are certainly worth mentioning.
Social Security Taxes: Generally, most states avoid taxing social security in their income tax schemes. However, if social security makes up a large portion of your retirement income, there are a few states where you’ll feel that pinch.

Capital Gains Tax: First, the definition of capital gain is when you buy something and sometime in the future you sell it for more than your purchase price. It could be stocks, real estate, or beanie babies and baseball cards. The map below combines both state and federal capital gains taxes for the highest income tax bracket. Of note: this map is a bit dated, but I think it’s a notable data point nonetheless.

Total Tax Burden: Since we’re comparing apples and oranges on all these maps it’s hard to gauge which states are “better” than the others. Further complicating possible comparisons, your situation may make one tax scheme more appealing than a different one. But, since maps are our theme for this writeup, here is the Tax Foundation’s opinion. This next map attempts to highlight the tax burden each state levies on their residents. Their methodology was to take the state and local taxes paid to each state and divide it by that state’s portion of the Net National Product. They believe this methodology better captures state taxes paid by residents since some portion of state revenues are allocated to nonresidents (via vacation homes, tourism, business taxes, etc.).

Estate Taxes: The final map we have for you is not so much about life or retirement, but rather what follows. If only death and taxes are inevitable, here is a map of states that hit you with both at the same time. Estate or inheritance taxes may be your kid’s problem, but if it’s a priority for you to preserve your wealth for future generations, it’s probably worth considering the impact of your state’s taxes in your estate planning process.

Hopefully you find these maps useful. If you have any questions about the maps or how your state’s tax regime impacts you, give us a call.
All the maps on this post come from the Tax Foundation. The Tax Foundation is a nonpartisan 501c(3) that studies taxation around the world and its impact on economic growth and opportunity.


Comments